A wedge is a chart pattern where price moves between two converging trendlines that both slope in the same direction. Wedges show a trend losing momentum and are watched closely by traders in stocks, crypto and forex.
Rising wedge
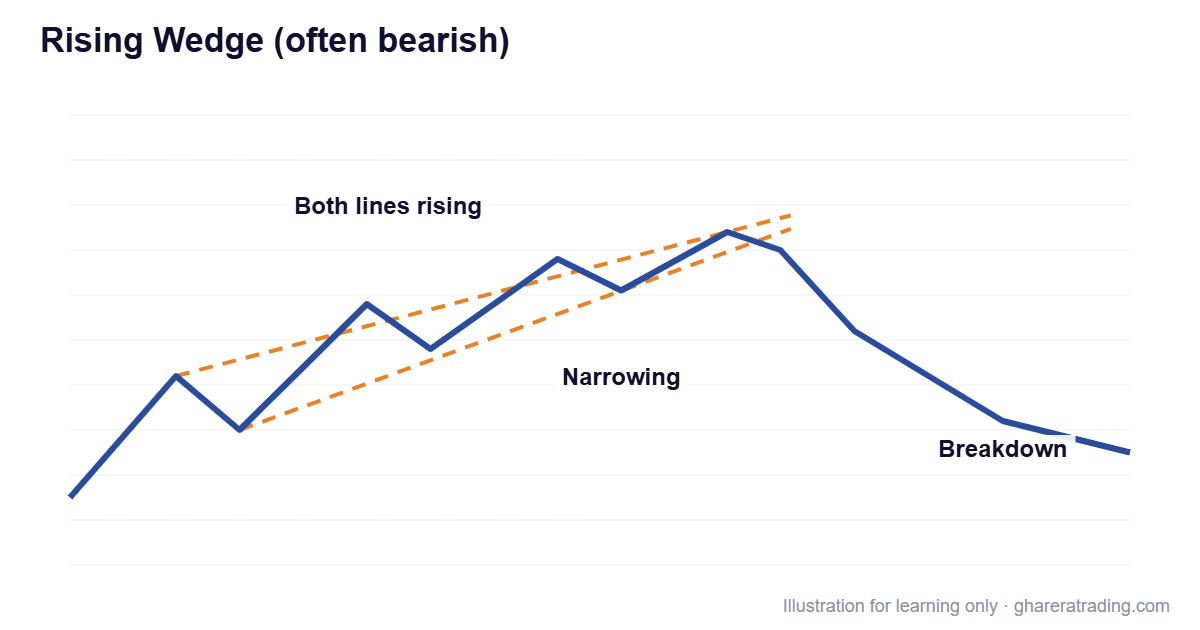
Both lines slope upwards, but the lower line rises faster than the upper one, so the pattern narrows. Price is still making higher highs, but each push up is smaller. A rising wedge is generally seen as a bearish pattern: a break below the lower line can lead to a fall.
Falling wedge
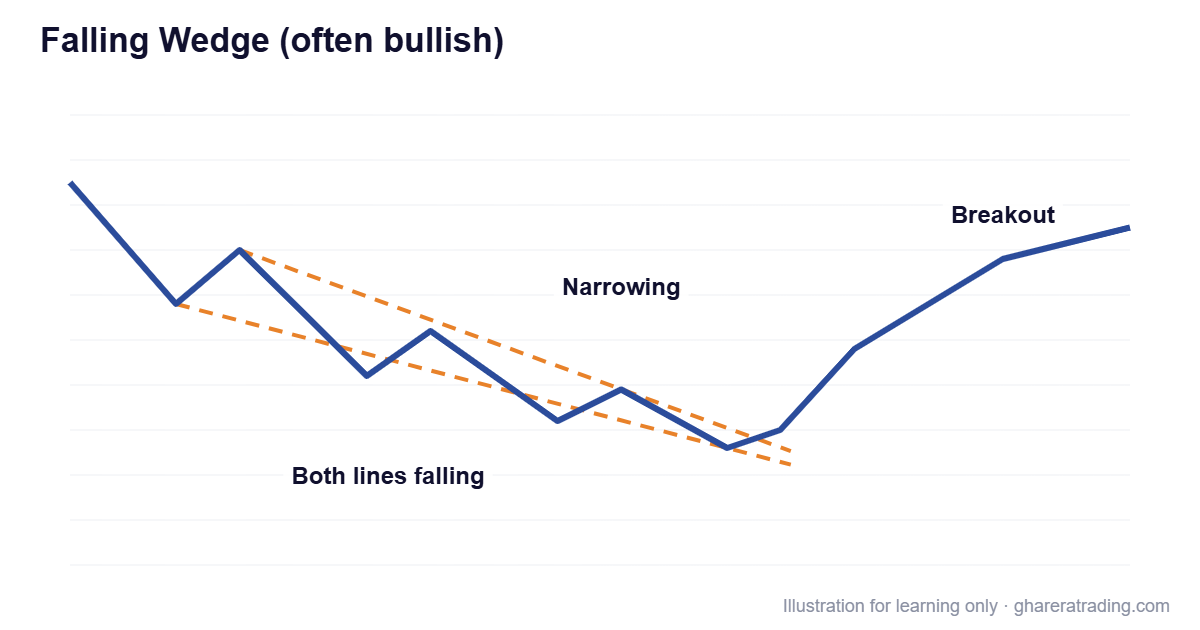
Both lines slope downwards and converge. Each new low is only slightly lower than the last, showing selling pressure is fading. A falling wedge is generally seen as a bullish pattern: a break above the upper line can lead to a rise.
Wedge vs triangle
In a triangle, the two lines point in different directions or one is flat. In a wedge, both lines slope the same way. This difference matters, because it changes what the pattern suggests about the trend.
What traders look for
- At least two touches on each line
- Momentum fading, for example RSI or MACD divergence
- A clear candle close outside the wedge before acting
- Rising volume on the breakout
Like all patterns, wedges fail regularly, which is why traders always define a stop loss.
Want to go beyond the basics?
This guide covers the basics of wedge patterns. Our technical analysis and trading course in Urdu takes you much further, with what this article leaves out:
- Complete trading strategies, with clear rules for entries, exits and stop losses
- Real chart examples, worked through step by step
- How to combine indicators, chart patterns and risk management into one plan
- Techniques you can apply to the Pakistan Stock Exchange, crypto, forex and other live markets
24 recorded lessons · about 11.5 hours · 12 months of access
This article is for education only and is not investment advice. Trading shares, cryptocurrencies, forex and other markets involves risk, including the loss of capital.