What trading volume is, how to read it with price, and why traders watch volume on breakouts, on stocks, crypto and other markets.
Learn PSX
Free beginner guides to technical analysis for PSX, crypto and forex traders: trends, indicators, chart patterns and risk management, explained simply with Urdu terms.
Pullback Trading: How to Join a Trend Without Chasing It
What a pullback is, how it differs from a reversal, and the areas where pullbacks often pause, explained for beginners.
Sideways Market and Range Trading: What to Do When There Is No Trend
How to recognise a sideways (range-bound) market, the basic ways traders approach it, and common mistakes to avoid.
Risk to Reward Ratio Explained: How to Calculate It and Why It Matters
How to calculate the risk-to-reward ratio, why it decides how often you need to be right, and how to keep targets realistic.
Multiple Timeframe Analysis: Why the Bigger Picture Matters
What multiple timeframe analysis is, how top-down analysis works, and how to choose timeframes for stocks, crypto and forex.
Pump and Dump, Insider Trading and Fake News: Market Traps to Avoid
How pump and dump schemes, insider trading, fake news and misleading results can hurt investors, and how to protect yourself.
Paper Trading and Demo Trading: How to Practise Without Real Money
What paper trading and demo trading are, how to practise step by step, and the limits of practising without real money.
Trading Psychology and Revenge Trading: Controlling Fear and Greed
How fear, greed, hope and FOMO affect trading, what revenge trading is, and habits that help traders stick to their plan.
Best Websites and Apps for PSX Research: Charts and Fundamentals
Widely used websites and apps for researching Pakistan Stock Exchange shares, from TradingView charts to the official PSX Data Portal.
Stock Market Myths: Is the Stock Market Gambling?
Five common stock market myths in Pakistan, including whether the stock market is gambling, and what is really true.
P/E Ratio, Dividends and Stock Splits Explained Simply
What the P/E ratio, dividends, stock splits and bonus shares mean, explained simply with examples for PSX investors.
Best EMA Settings for Trading: 9, 21, 50 and 200 EMA Explained
What the 9, 21, 50 and 200 EMA settings are used for, EMA vs SMA, crossovers, dynamic support and trailing exits on stocks, crypto and forex.
MACD Indicator Explained: Settings, Crossovers, Histogram and Divergence
How the MACD indicator works, its 12-26-9 settings, signal line crossovers, the histogram and divergence, and how it compares with RSI.
Trend Identification: How to Spot Uptrends, Downtrends and Sideways Markets
How to identify a trend on any chart using swing highs and lows, trendlines, moving averages and indicators, and how the trend should shape your trades.
Technical Analysis for Beginners: One Skill for Stocks, Crypto and Forex
Technical analysis explained for beginners: trends, support and resistance, chart patterns, indicators and risk, and why the same skills work on PSX, crypto and forex.
Triangle Patterns: Ascending, Descending and Symmetrical Triangles Explained
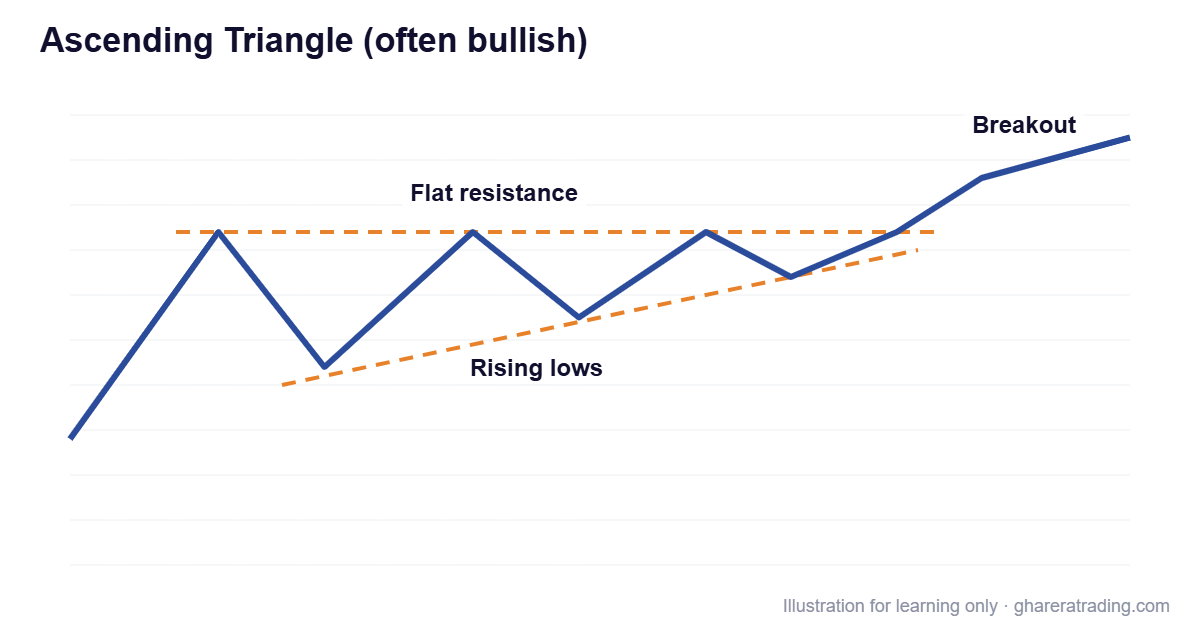
The three types of triangle chart pattern explained simply: ascending, descending and symmetrical, and what traders watch on a breakout.
Pennant Pattern: Bullish and Bearish Pennants Explained
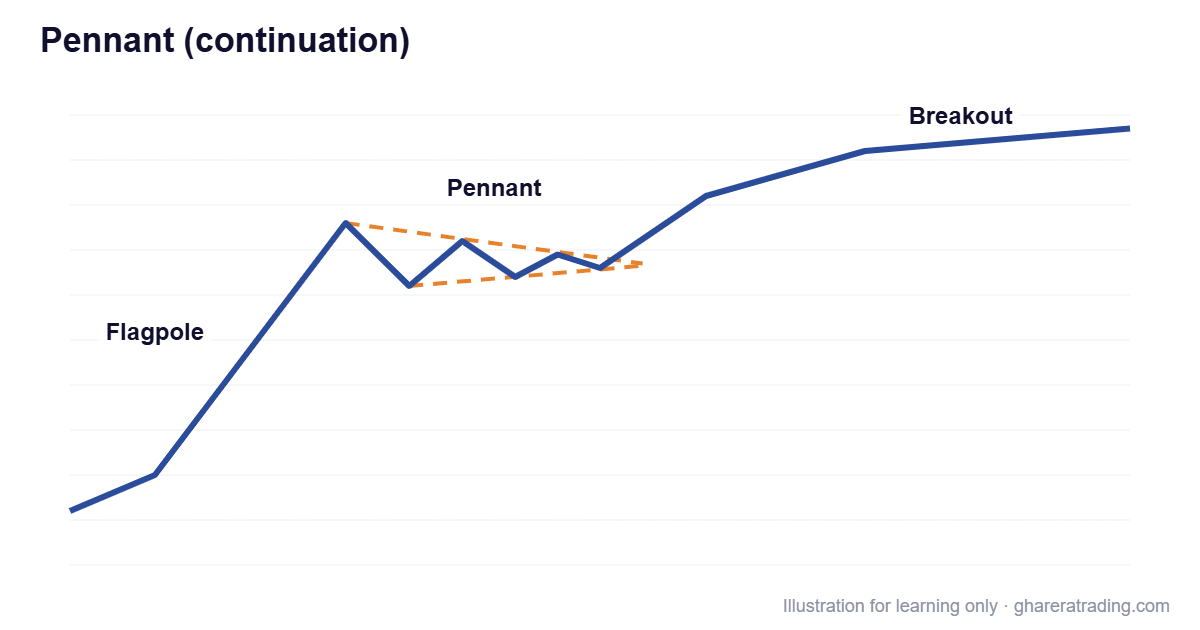
What a pennant chart pattern is, how it forms after a sharp move, and how it differs from flags and symmetrical triangles.
Flag Pattern: Bull Flag and Bear Flag Explained
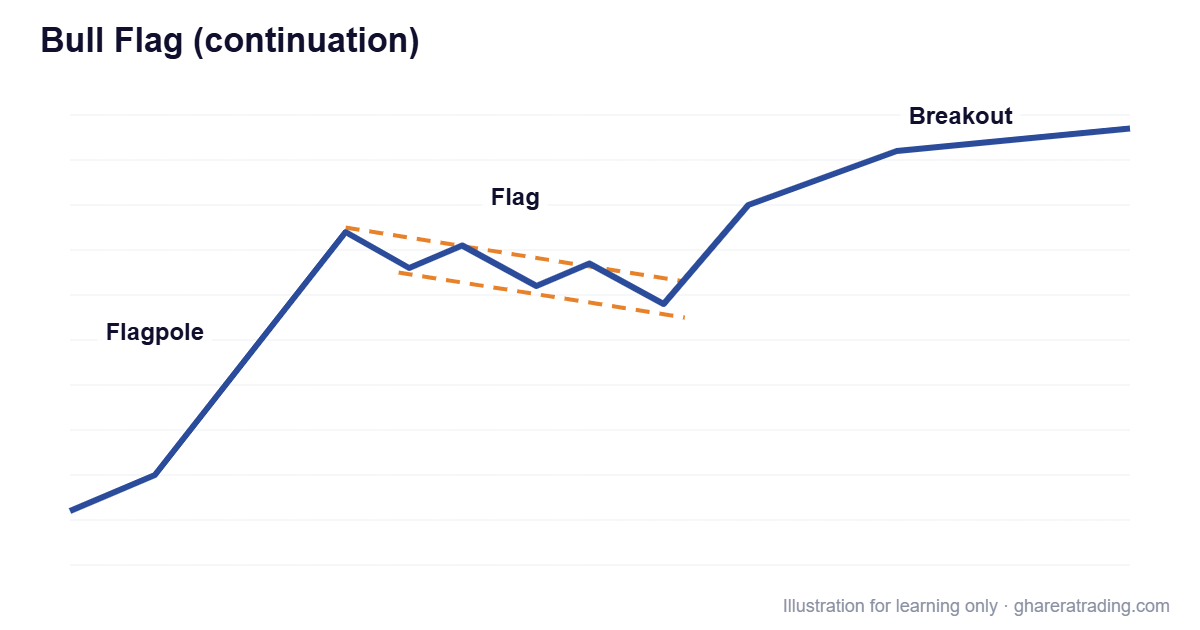
What bull and bear flag patterns are, how the flagpole and flag form, and what makes a flag more convincing.
Cup and Handle Pattern: How It Forms and What It Suggests
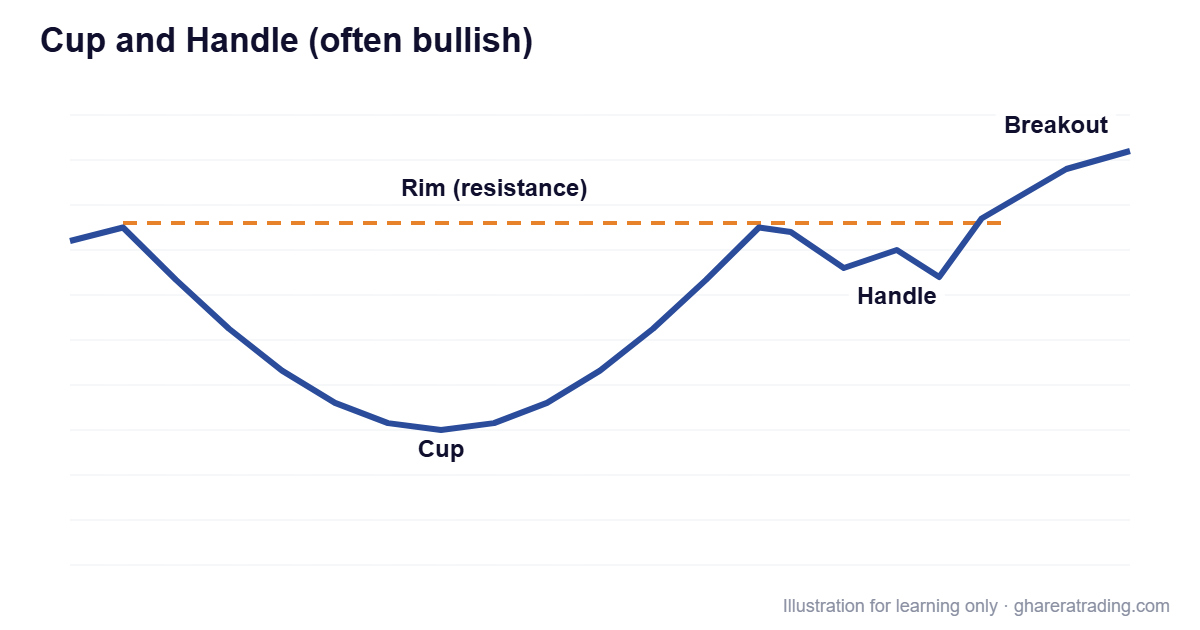
The cup and handle chart pattern explained simply, including the inverted cup and handle, and what beginners should check.
Double Top and Double Bottom Patterns Explained
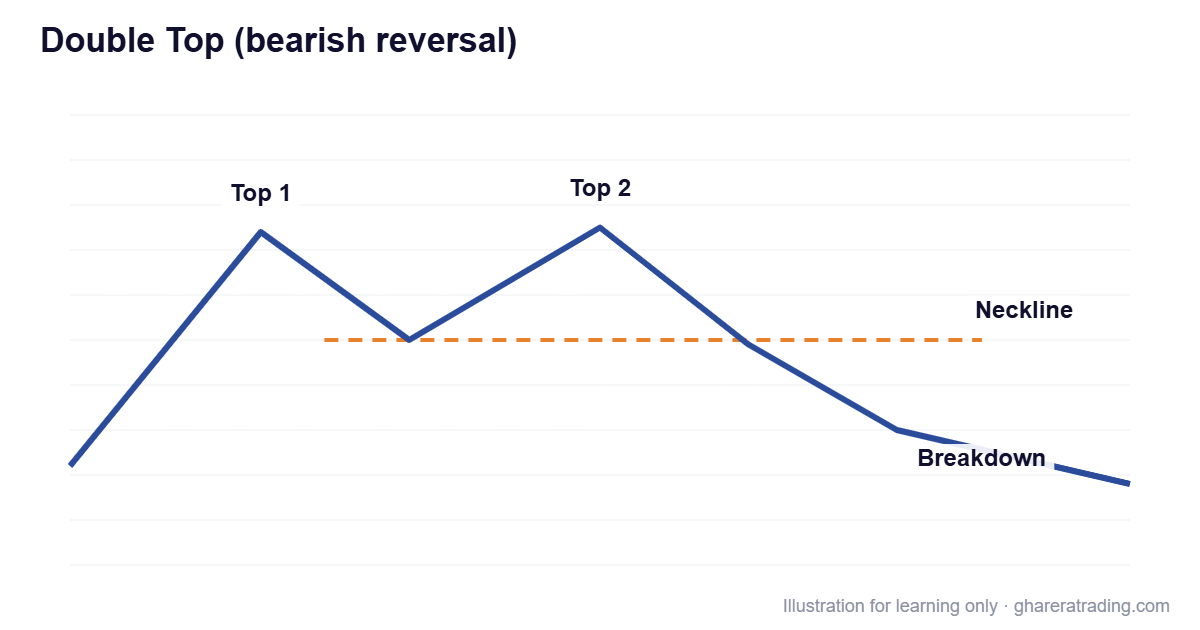
How double top and double bottom reversal patterns form, why the neckline matters, and a common beginner mistake to avoid.
Head and Shoulders Pattern and Inverse Head and Shoulders Explained
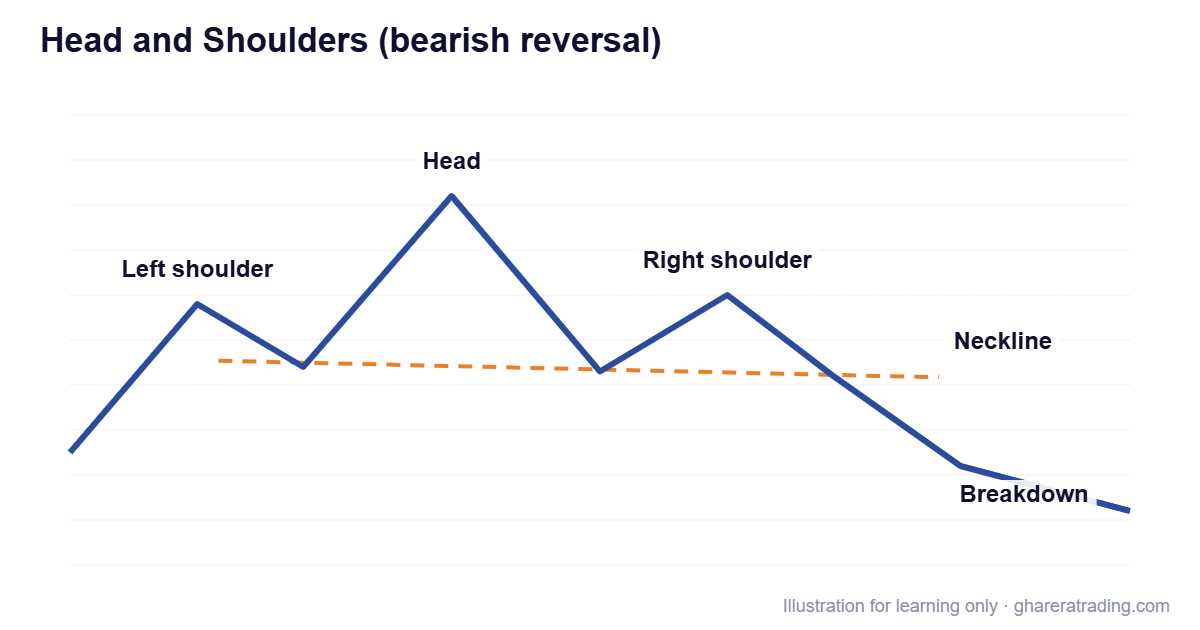
How the head and shoulders and inverse head and shoulders reversal patterns form, what the neckline is, and what beginners should know.
Bump and Run Pattern: When Hype Turns Into a Reversal
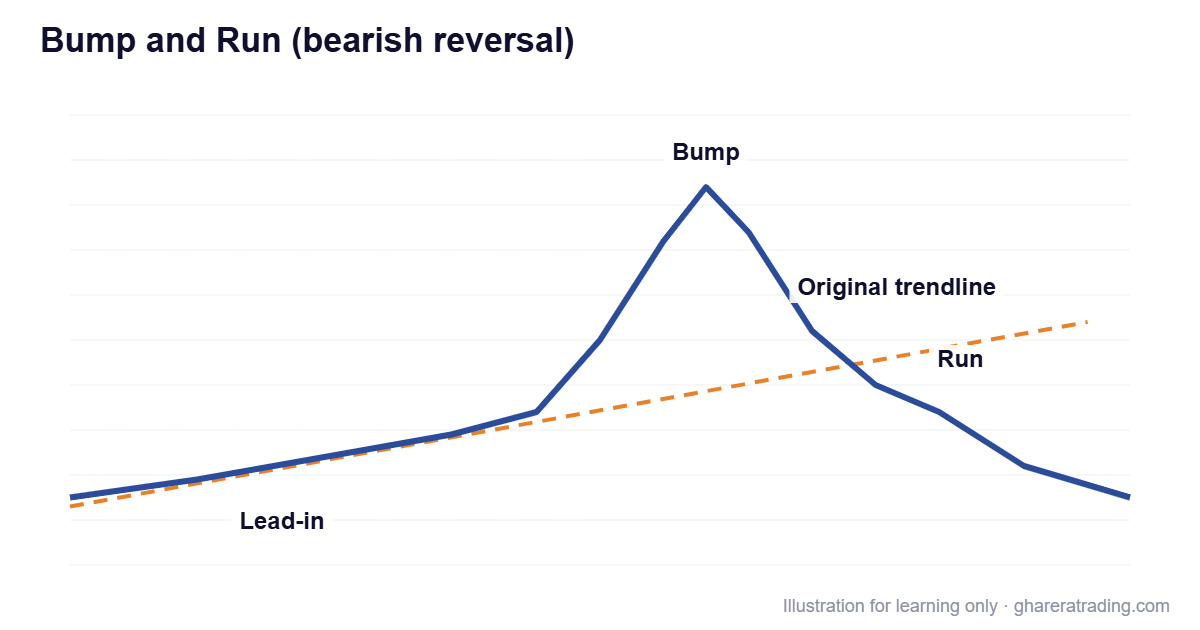
The bump and run reversal pattern explained: lead-in, bump and run phases, the inverted version, and why it matters for beginners.
Triple Top and Triple Bottom Patterns Explained
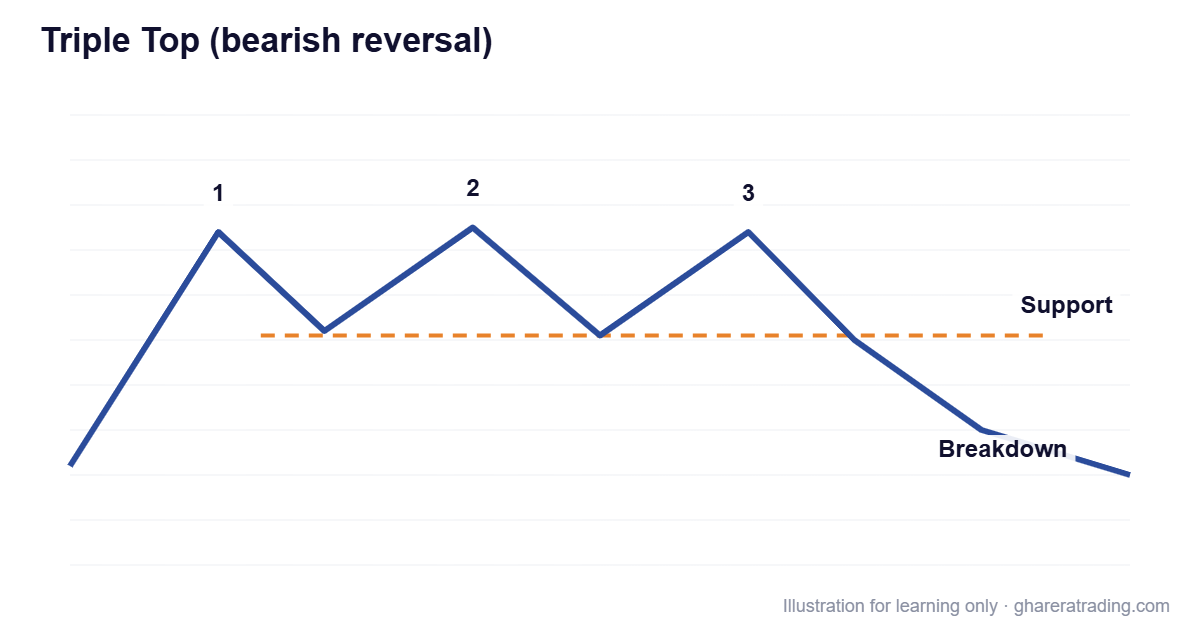
How triple top and triple bottom reversal patterns form, how they differ from a range, and what beginners should keep in mind.
Rounding Bottom and Rounding Top Patterns (U-Shape and Arc) Explained
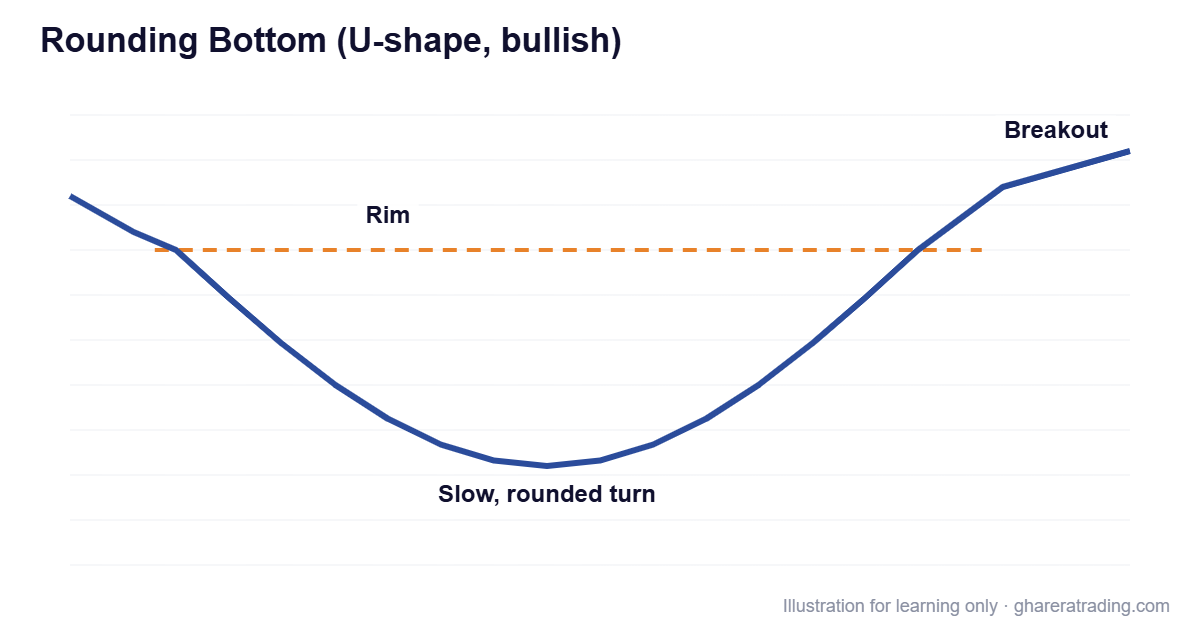
Rounding bottom (saucer) and rounding top (arc) patterns explained simply, and how they differ from V-shape reversals.
V-Shape Reversal and Inverted V Pattern Explained
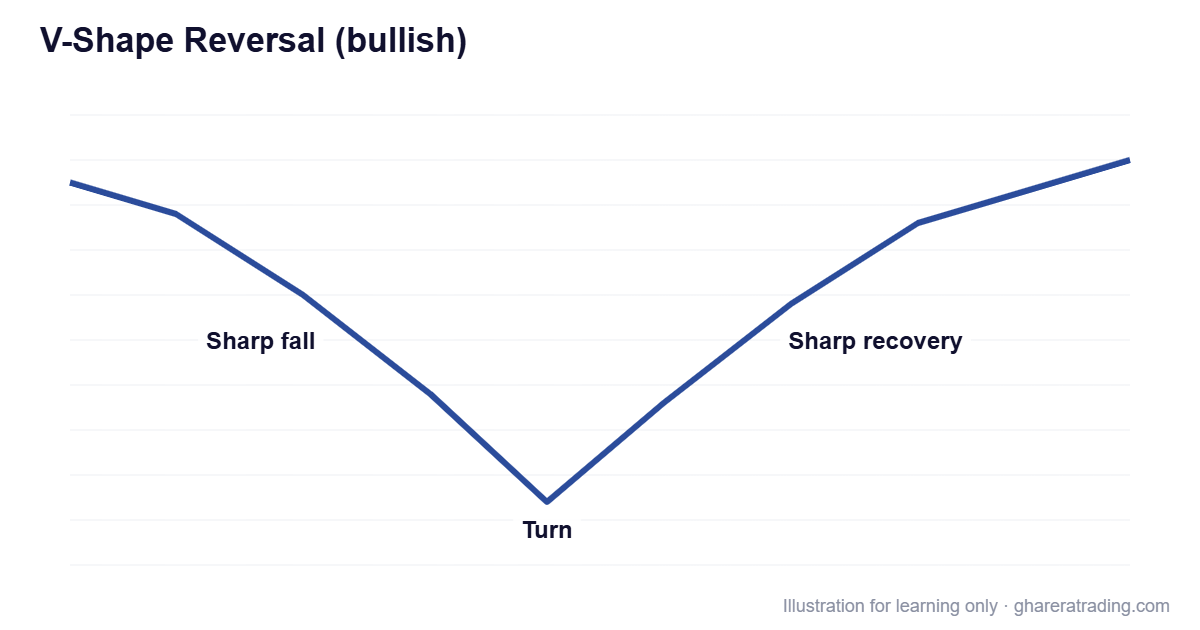
What V-shape and inverted V reversals are, why they are hard to trade, and what beginners can learn from them.
Wedge Pattern: Rising Wedge and Falling Wedge Explained
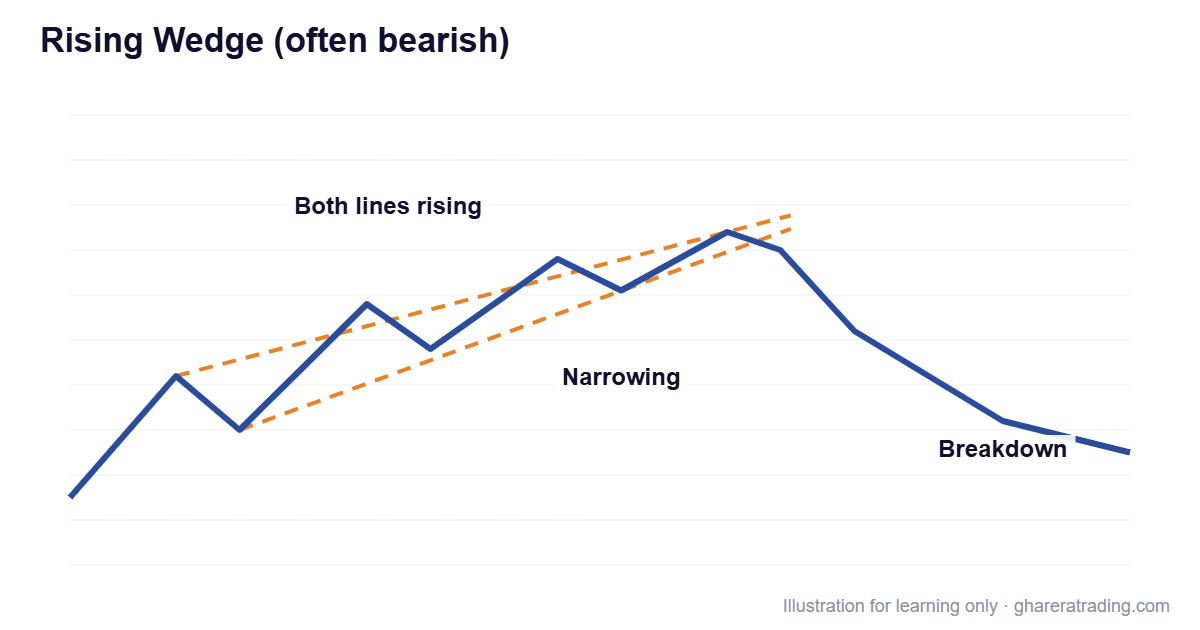
What rising and falling wedge patterns are, how they differ from triangles, and what traders look for before acting.
Reversal Chart Patterns: Triple Top, V-Shape, Rounding Bottom and Bump and Run
Key trend reversal chart patterns explained simply: triple tops and bottoms, V-shape and U-shape reversals, and bump and run.
Trendlines and Price Channels: How to Draw Them and What They Show
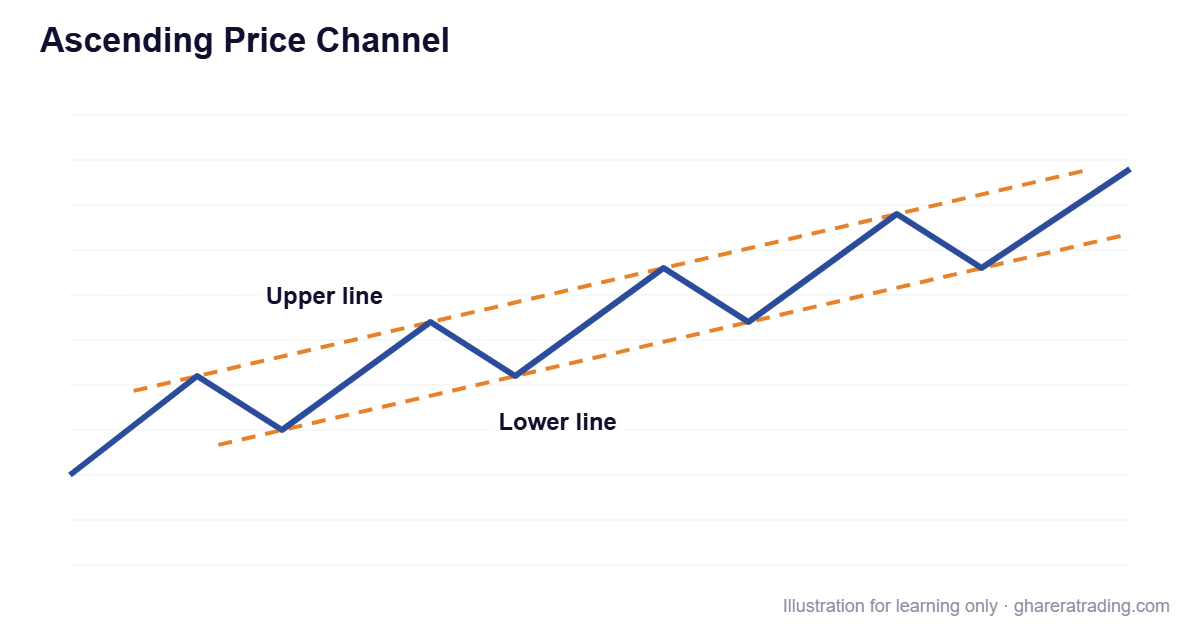
How to draw trendlines and price channels, what ascending, descending and horizontal channels show, and why trendline breaks matter.
Chart Patterns: Head and Shoulders, Double Tops, Triangles and How to Trade Them
The most important reversal and continuation chart patterns, and a simple five-step framework for trading them on stocks, crypto and forex.
Trading vs Investing: Which Is Better for Beginners in Pakistan?
Trading vs investing in the Pakistan Stock Exchange: how they differ in time, analysis, costs and risk, and which suits beginners.
Risk Management in Trading in Urdu: 7 Rules to Protect Your Capital
Seven practical risk management rules for PSX traders, explained with Urdu terms: position sizing, stop losses, risk-reward and controlling emotions.
Fibonacci Retracement in Urdu: Levels, How to Draw It and How to Use It
Fibonacci retracement explained for PSX traders: the key levels, how to draw them, a worked example, and how to combine them with support and resistance.
RSI Indicator Explained in Urdu: Overbought, Oversold and Divergence
RSI indicator explained simply with Urdu terms: what overbought and oversold mean, reading RSI with the trend, divergence and common mistakes.
Can You Short Sell in PSX? How Short Selling Works in Pakistan
Can we short sell in PSX? How short selling works in Pakistan, why blank sales are not allowed in the ready market, how the futures market is used, and the risks.
Supertrend Indicator: Settings, Signals and How to Use It on PSX Charts
How the Supertrend indicator works, what its period and multiplier settings change, and three ways to use it on Pakistan Stock Exchange charts.
How to Invest in PSX: A Beginner’s Guide for Pakistan
A step-by-step beginner’s guide to investing in the Pakistan Stock Exchange: opening an account, arranging funds, basic analysis and managing risk.
PSX Account Opening Online: Requirements, Documents and Step-by-Step Process
How to open a Pakistan Stock Exchange trading account online: requirements, documents, Sahulat vs standard accounts, CDC and UIN, and safety tips.
Candlestick Patterns in Urdu: 8 Patterns Every PSX Beginner Should Know
How to read a candlestick and 8 key patterns (hammer, doji, engulfing, morning star and more) explained for Pakistan Stock Exchange beginners.
Support and Resistance Meaning in Urdu: How to Find Levels on PSX Charts
Support and resistance explained in simple Urdu terms: what they mean, how to find them on PSX charts, role reversal, breakouts and common mistakes.
Stop Loss Kya Hai? Stop Loss and Trailing Stop Loss in PSX, Explained in Urdu
What a stop loss is, how a trailing stop loss works, and how to place both on Pakistan Stock Exchange charts, explained simply with Urdu terms.
Want to go beyond the basics?
These free guides cover the essentials. Our Urdu technical analysis course shows you complete strategies, real chart examples and risk management, step by step.