Chart patterns are recognisable shapes that price forms on a chart. They reflect the battle between buyers and sellers and can hint at whether a trend is likely to continue or reverse. This guide covers the most important chart patterns and how traders use them, on the Pakistan Stock Exchange, crypto, forex or any other market.
Two families of patterns
- Reversal patterns suggest the current trend may be ending.
- Continuation patterns suggest the trend is pausing before carrying on.
Reversal patterns
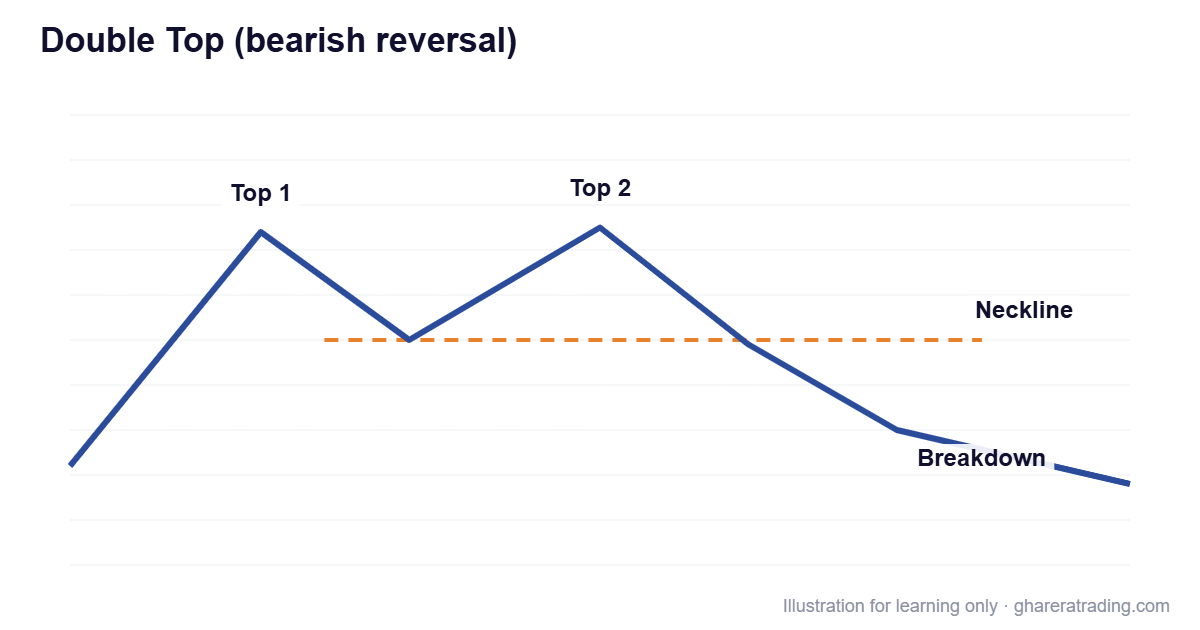
Double top and double bottom
A double top forms when price hits roughly the same high twice and fails to break it, with a dip (the “neckline”) in between. It is confirmed when price closes below the neckline. A double bottom is the mirror image after a fall and is confirmed by a close above the neckline.
Head and shoulders
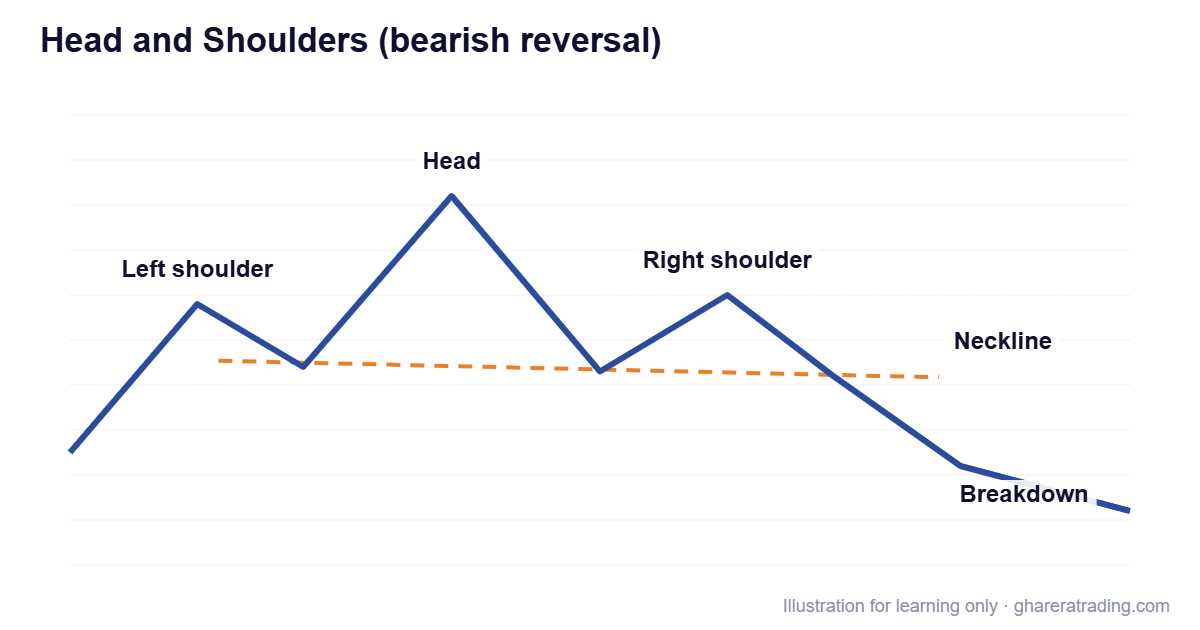
Three peaks: a higher middle peak (the head) between two lower peaks (the shoulders). A line through the lows between them is the neckline. A close below the neckline suggests the uptrend has ended. The inverse head and shoulders appears after a downtrend and signals a possible move up.
Continuation patterns
Triangles
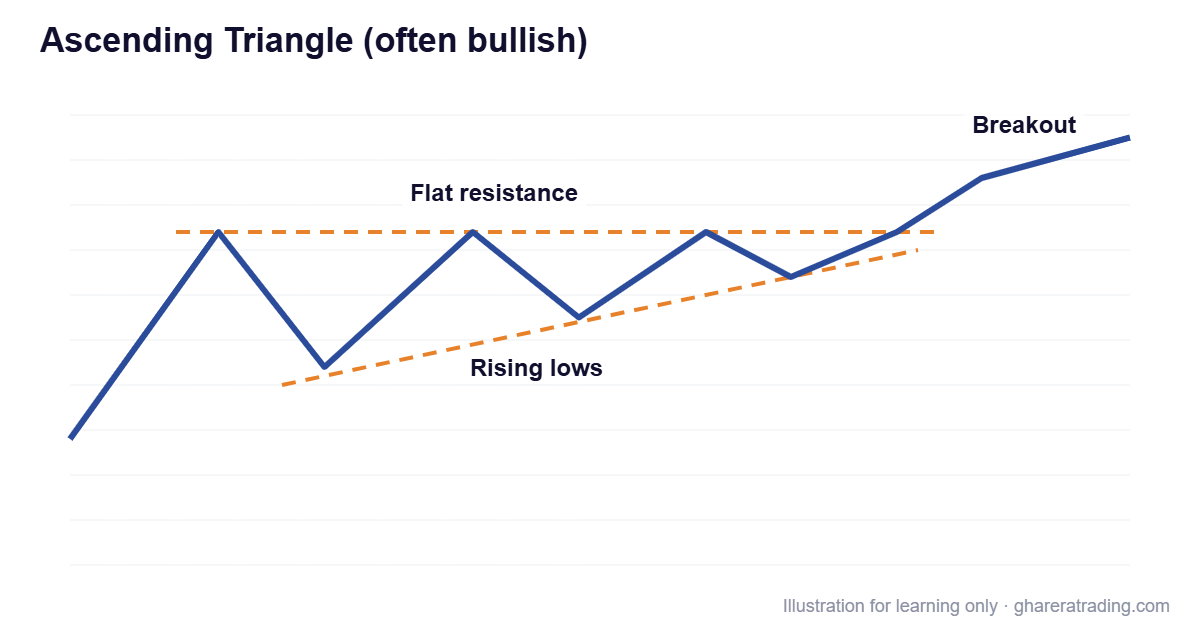
- Ascending triangle: flat resistance with rising lows. Buyers are getting more aggressive, so the breakout is often upwards.
- Descending triangle: flat support with falling highs; the breakout is often downwards.
- Symmetrical triangle: highs falling and lows rising; the breakout can go either way, usually in the direction of the prior trend.
Flags and pennants
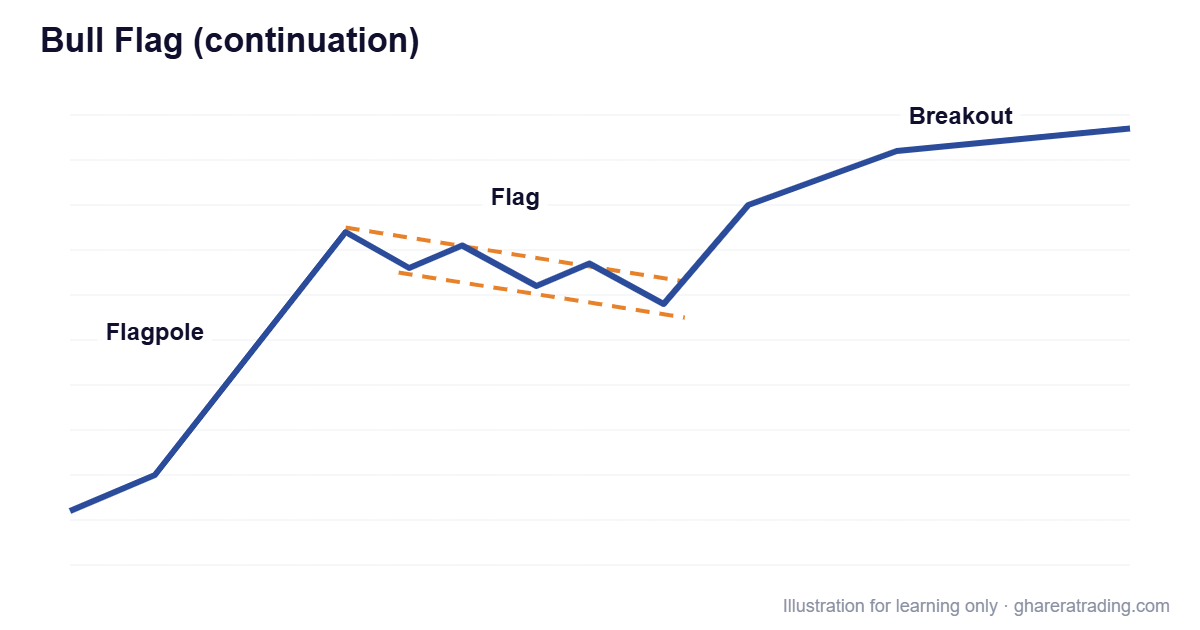
After a sharp move (the “flagpole”), price drifts in a small channel (flag) or a small triangle (pennant) before often continuing in the same direction.
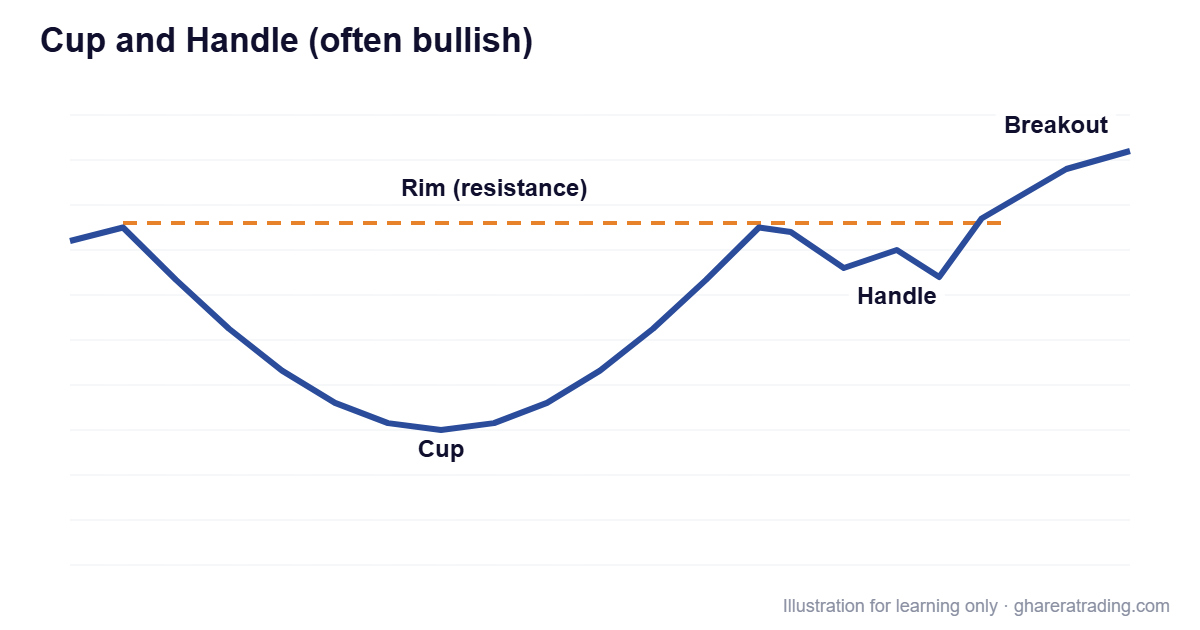
Cup and handle
A rounded bottom (the cup) followed by a small pullback (the handle) near the previous high. A breakout above the high suggests continuation of the uptrend.
How to trade chart patterns: a simple framework
- Check the trend first. Patterns work best in the context of the bigger trend. See trend identification.
- Wait for confirmation. A pattern is not complete until price closes beyond the neckline or breakout level. Many traders also want rising volume.
- Plan the entry. Either enter on the breakout close, or wait for a retest of the broken level, which often acts as new support or resistance.
- Set the stop loss. Place it on the other side of the pattern or the neckline, where the pattern would be proven wrong. See stop loss.
- Estimate a target. A common method is to measure the height of the pattern and project it from the breakout point. Treat it as a guide, not a promise.
Common mistakes
- Seeing patterns everywhere and entering before they are confirmed
- Ignoring the overall trend
- Trading patterns on very thinly traded shares or coins, where they are unreliable
- Risking too much on a single “perfect” pattern (see risk management)
Guides to each pattern
- Head and shoulders and inverse head and shoulders
- Double top and double bottom
- Triple top and triple bottom
- Ascending, descending and symmetrical triangles
- Rising and falling wedges
- Bull and bear flags
- Pennants
- Cup and handle
- Rounding bottom and rounding top
- V-shape and inverted V reversals
- Bump and run
- Trendlines and price channels
Want to go beyond the basics?
This guide covers the basics of chart patterns. Our technical analysis and trading course in Urdu takes you much further, with what this article leaves out:
- Complete trading strategies, with clear rules for entries, exits and stop losses
- Real chart examples, worked through step by step
- How to combine indicators, chart patterns and risk management into one plan
- Techniques you can apply to the Pakistan Stock Exchange, crypto, forex and other live markets
24 recorded lessons · about 11.5 hours · 12 months of access
This article is for education only and is not investment advice. Trading involves risk, including the loss of capital.