Reversal patterns are chart shapes that suggest a trend may be coming to an end. Alongside the well-known head and shoulders and double tops, several other reversal shapes appear on stock, crypto and forex charts.
Triple top and triple bottom
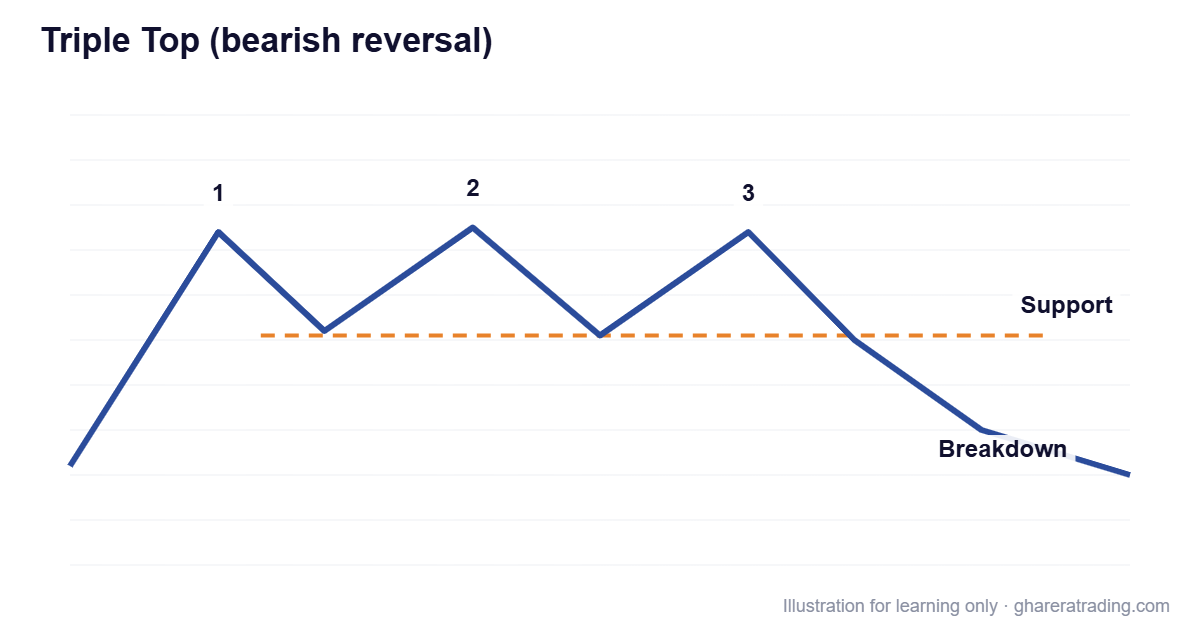
A triple top forms when price tests the same high three times and fails each time. It is generally seen as bearish once price breaks below the lows between the peaks. A triple bottom is the mirror image after a decline and is generally seen as bullish.
V-shape reversal
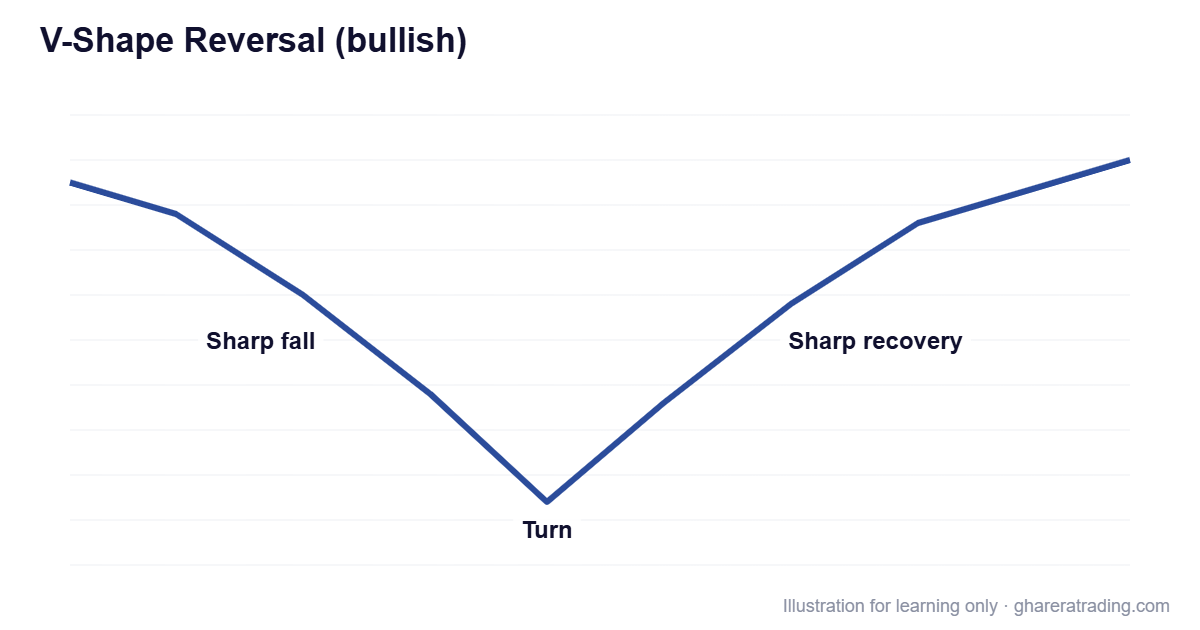
A sharp fall followed by an equally sharp rise (or the inverted version at a top). V-shapes are fast and hard to trade because there is little time to react and no pause to confirm the turn.
U-shape (rounding) reversal
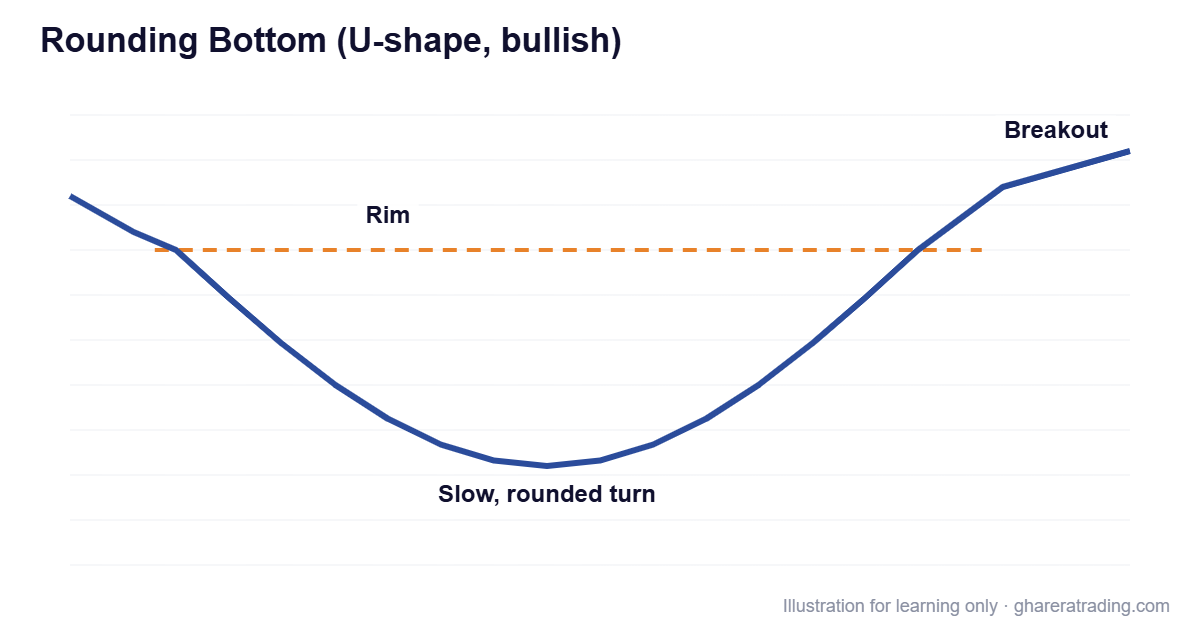
A slow, gradual turn, where the trend loses momentum, moves sideways for a while and then reverses. Rounding bottoms often develop over weeks or months on daily charts.
Bump and run
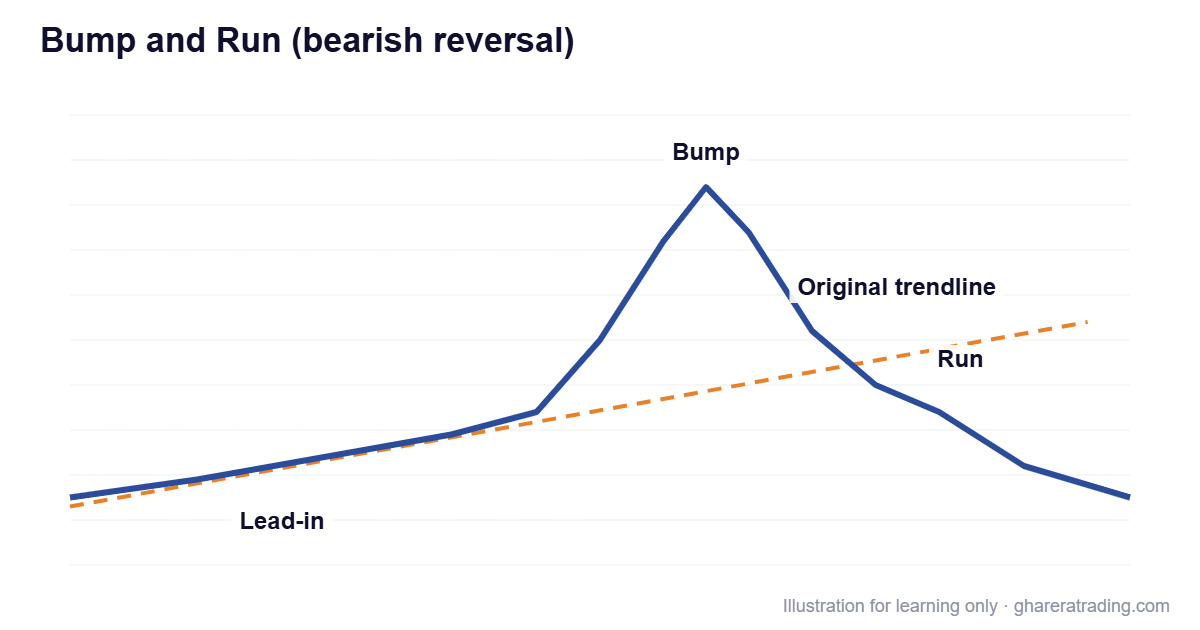
A pattern where a steady trend suddenly turns into a steep, excited move (the “bump”), often driven by speculation, before collapsing back through the original trendline (the “run”). It reflects how overexcited moves can reverse sharply.
General principles for reversal patterns
- A reversal pattern needs an existing trend to reverse.
- Wait for confirmation: a close beyond the key level, ideally with higher volume.
- Patterns on higher timeframes are usually more meaningful.
- Many apparent reversals fail, so planning risk matters more than spotting the shape.
Want to go beyond the basics?
This guide covers the basics of reversal patterns. Our technical analysis and trading course in Urdu takes you much further, with what this article leaves out:
- Complete trading strategies, with clear rules for entries, exits and stop losses
- Real chart examples, worked through step by step
- How to combine indicators, chart patterns and risk management into one plan
- Techniques you can apply to the Pakistan Stock Exchange, crypto, forex and other live markets
24 recorded lessons · about 11.5 hours · 12 months of access
This article is for education only and is not investment advice. Trading shares, cryptocurrencies, forex and other markets involves risk, including the loss of capital.