A trendline is a straight line drawn on a chart to connect price points and show the direction of a trend. A price channel adds a second, parallel line, so price moves between two boundaries. They are among the simplest and most useful tools in technical analysis, on stocks, crypto and forex alike.
How trendlines are drawn
- Uptrend line: connect two or more higher lows. Price tends to stay above it while the uptrend lasts.
- Downtrend line: connect two or more lower highs. Price tends to stay below it.
The more times price touches a line and respects it, the more traders notice it.
What a channel shows
When you draw a parallel line on the other side of price, you get a channel:
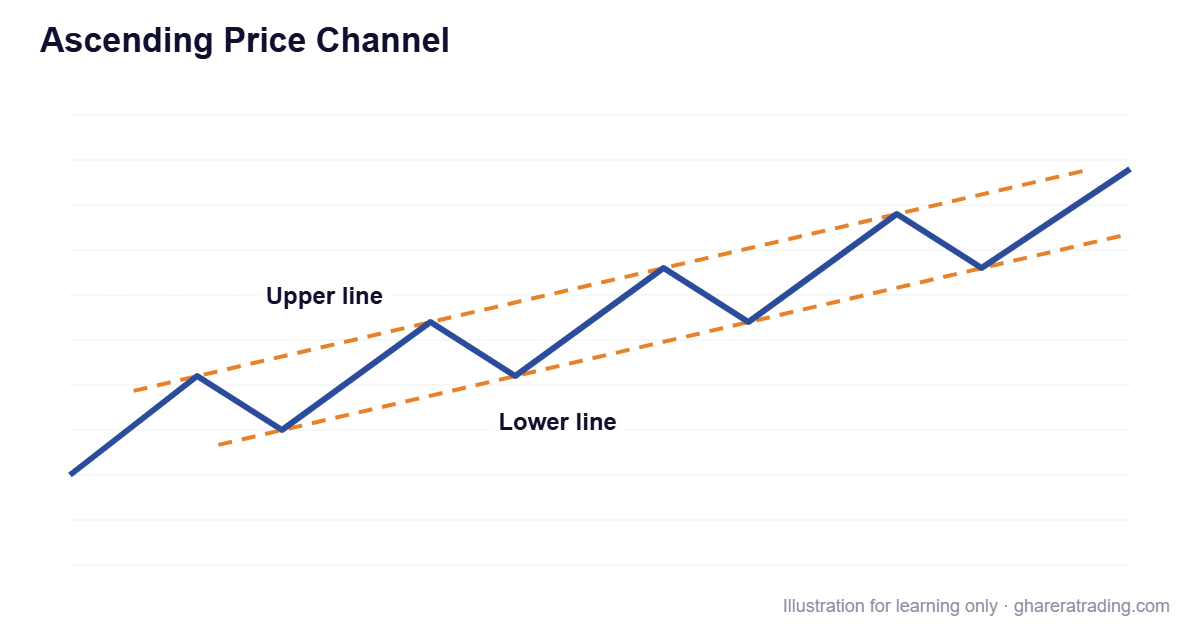
- Ascending channel: rising lines; an uptrend moving in a steady range.
- Descending channel: falling lines; a steady downtrend.
- Horizontal channel: flat lines; a sideways market.
Why trendline breaks matter
A clear close through a long-standing trendline is an early sign that the trend may be changing. It does not guarantee a reversal; price can break a line and then carry on. Traders usually look for confirmation, such as a retest of the broken line or higher volume.
Common beginner mistakes
- Forcing a line through candles to make it “fit”
- Drawing lines on very short timeframes only
- Treating every small break as a signal
Want to go beyond the basics?
This guide covers the basics of trendlines and channels. Our technical analysis and trading course in Urdu takes you much further, with what this article leaves out:
- Complete trading strategies, with clear rules for entries, exits and stop losses
- Real chart examples, worked through step by step
- How to combine indicators, chart patterns and risk management into one plan
- Techniques you can apply to the Pakistan Stock Exchange, crypto, forex and other live markets
24 recorded lessons · about 11.5 hours · 12 months of access
This article is for education only and is not investment advice. Trading shares, cryptocurrencies, forex and other markets involves risk, including the loss of capital.