The double top and double bottom are simple, common reversal patterns. They show price failing twice at the same level, which can mean the trend is running out of strength. They are found on stock, crypto and forex charts.
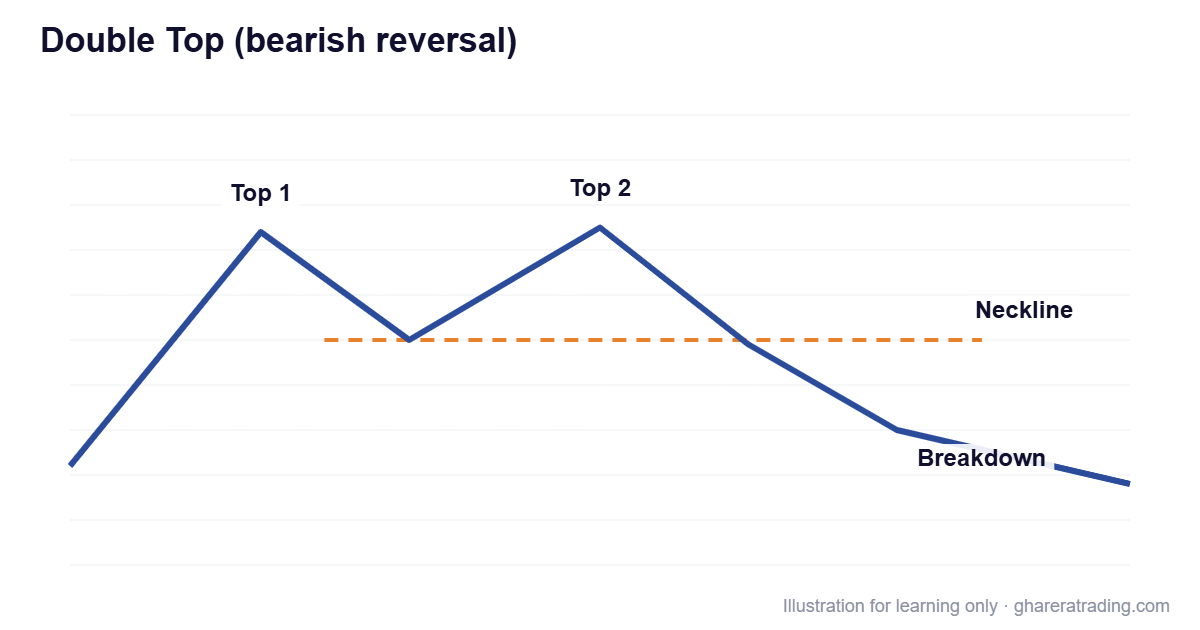
Double top (bearish)
Price rises to a high, pulls back, then rises again to roughly the same high and fails. The low between the two peaks is called the neckline. The pattern is generally treated as complete when price closes below the neckline, suggesting the uptrend may have ended. In Urdu terms, buyers tried twice to break the chhat (ceiling) and failed.
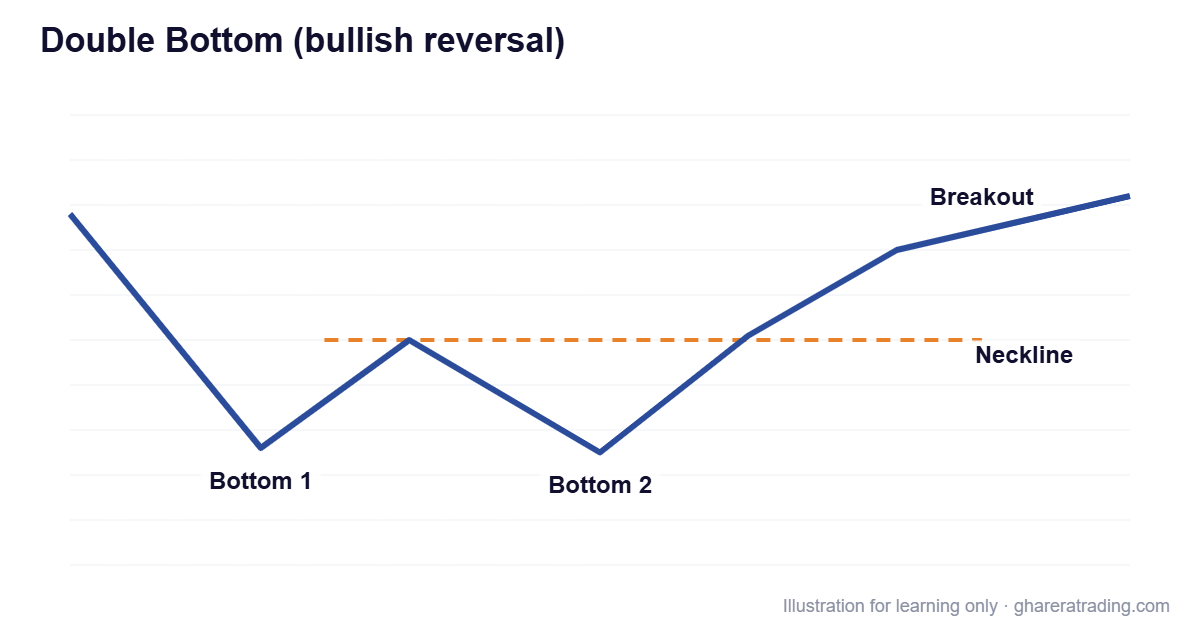
Double bottom (bullish)
The mirror image after a decline: price falls to a low, bounces, falls to roughly the same low again and holds. A close above the high between the two lows (the neckline) is the key event, suggesting the downtrend may have ended.
What makes these patterns more reliable
- A clear prior trend
- Some time between the two peaks or troughs, not just a few candles
- Higher volume when the neckline breaks
- Momentum divergence on RSI or MACD at the second peak or trough
A common beginner mistake
Calling a double top as soon as price touches the old high a second time. Until the neckline breaks, it may simply be resistance that will later break upwards.
Related: triple top and triple bottom and our chart patterns guide.
Want to go beyond the basics?
This guide covers the basics of double tops and bottoms. Our technical analysis and trading course in Urdu takes you much further, with what this article leaves out:
- Complete trading strategies, with clear rules for entries, exits and stop losses
- Real chart examples, worked through step by step
- How to combine indicators, chart patterns and risk management into one plan
- Techniques you can apply to the Pakistan Stock Exchange, crypto, forex and other live markets
24 recorded lessons · about 11.5 hours · 12 months of access
This article is for education only and is not investment advice. Trading shares, cryptocurrencies, forex and other markets involves risk, including the loss of capital.