The head and shoulders is one of the best-known reversal patterns in technical analysis. It suggests that an uptrend may be turning into a downtrend. Its mirror image, the inverse head and shoulders, suggests a downtrend may be turning up. Both appear on stock, crypto and forex charts.
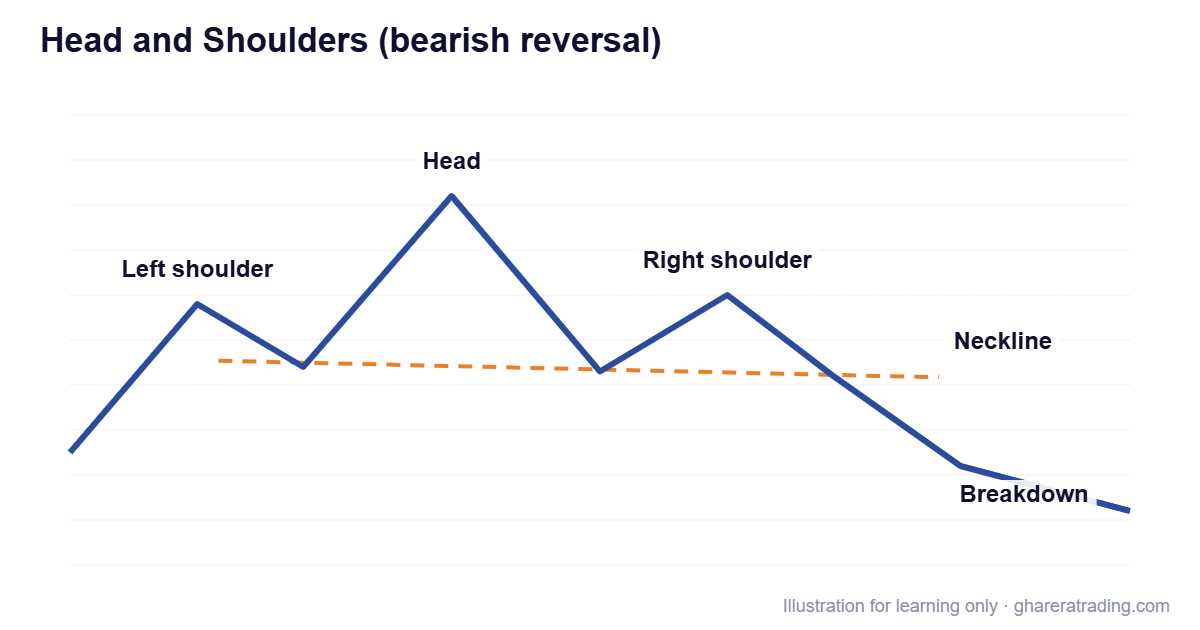
Head and shoulders (bearish)
- Left shoulder: a peak, then a pullback.
- Head: a higher peak, then another pullback.
- Right shoulder: a lower peak, roughly level with the left shoulder.
- Neckline: a line drawn through the lows between the peaks.
The pattern is generally considered complete when price closes below the neckline. The failure to make a new high on the right shoulder shows buyers losing strength.
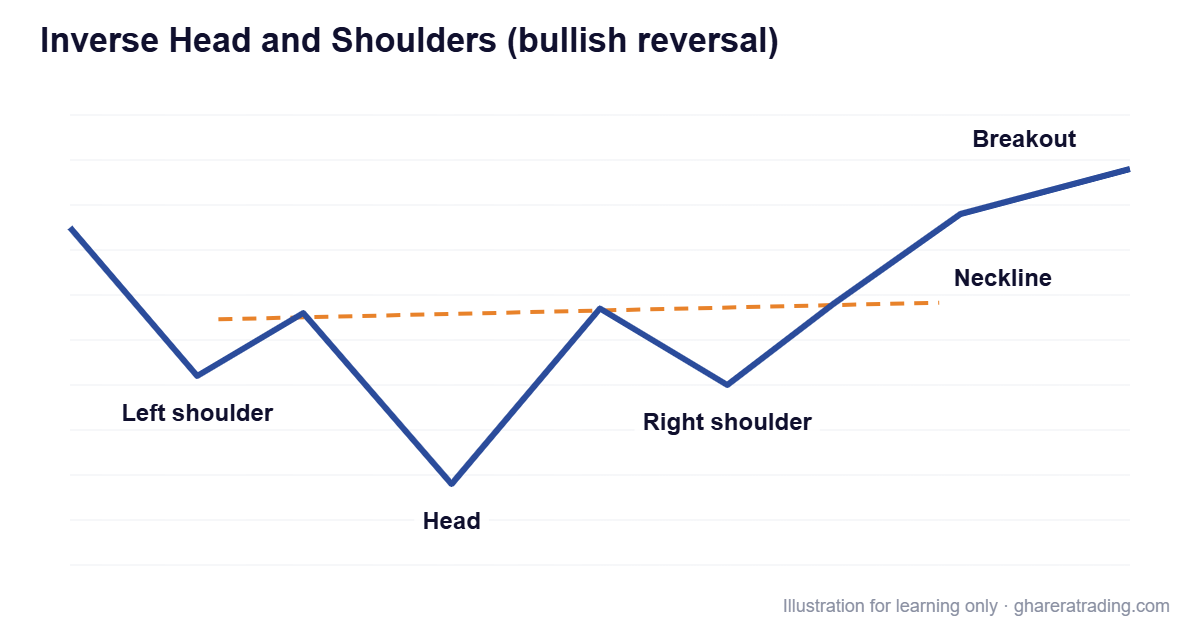
Inverse head and shoulders (bullish)
The upside-down version after a downtrend: a low (left shoulder), a lower low (head), and a higher low (right shoulder). A close above the neckline is the key event.
What beginners should know
- The pattern needs an existing trend to reverse.
- Necklines can slope; they are not always horizontal.
- Price sometimes returns to test the broken neckline before moving on.
- Many patterns that look like head and shoulders never complete, so traders wait for confirmation.
Related: double top and double bottom, other reversal patterns and our chart patterns guide.
Want to go beyond the basics?
This guide covers the basics of the head and shoulders pattern. Our technical analysis and trading course in Urdu takes you much further, with what this article leaves out:
- Complete trading strategies, with clear rules for entries, exits and stop losses
- Real chart examples, worked through step by step
- How to combine indicators, chart patterns and risk management into one plan
- Techniques you can apply to the Pakistan Stock Exchange, crypto, forex and other live markets
24 recorded lessons · about 11.5 hours · 12 months of access
This article is for education only and is not investment advice. Trading shares, cryptocurrencies, forex and other markets involves risk, including the loss of capital.