The bump and run pattern describes what happens when a calm trend turns into an excited, speculative surge, and then collapses. It is a lesson in market psychology as much as a chart pattern, and it appears on shares, crypto and forex alike.
The three phases
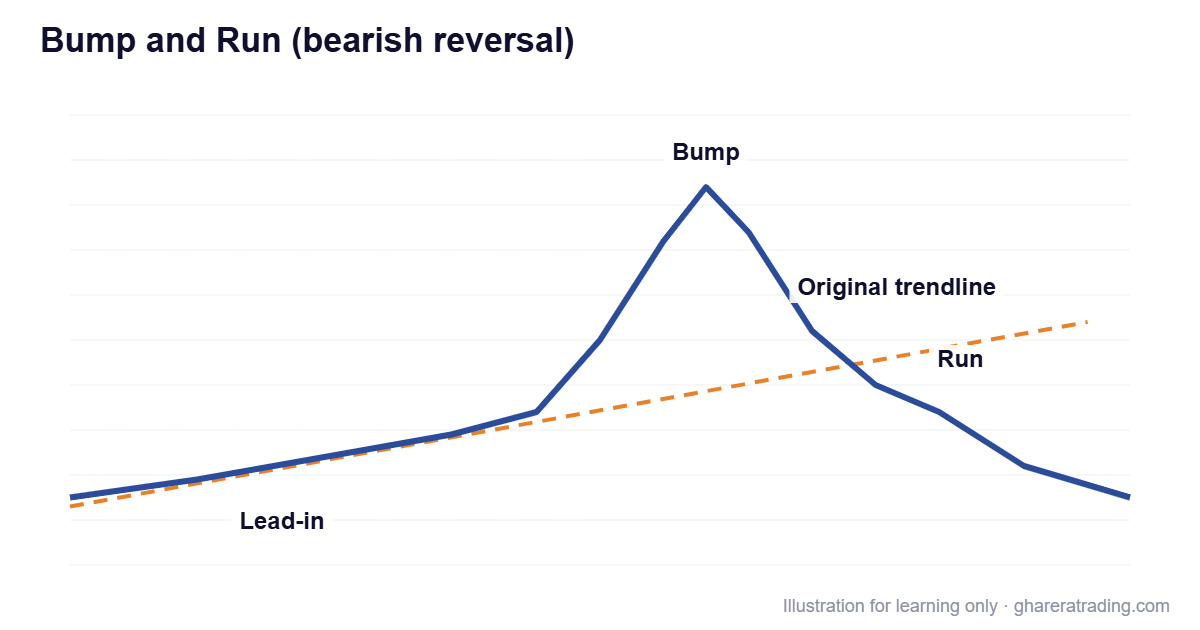
- Lead-in: a steady, moderate trend. A trendline can be drawn under it.
- Bump: price suddenly accelerates, rising much more steeply than before, often driven by hype, news or speculation. Volume usually rises sharply.
- Run: the excitement fades, price falls back, breaks the original lead-in trendline, and can keep falling.
Inverted bump and run
The mirror image in a downtrend: a steady decline, a sudden panic-driven plunge, and then a recovery that breaks above the original downtrend line.
Why this pattern matters
It shows how quickly overexcited moves can reverse. Beginners often buy during the “bump” because the price is rising fast and everyone is talking about it, just before the “run” phase. Recognising the shape can help you avoid chasing hype. See trading psychology and pump and dump schemes.
Things to watch
- A very steep move compared with the earlier trend
- Unusually high volume during the bump
- A clear break of the original trendline as confirmation
See all patterns in our chart patterns guide.
Want to go beyond the basics?
This guide covers the basics of the bump and run pattern. Our technical analysis and trading course in Urdu takes you much further, with what this article leaves out:
- Complete trading strategies, with clear rules for entries, exits and stop losses
- Real chart examples, worked through step by step
- How to combine indicators, chart patterns and risk management into one plan
- Techniques you can apply to the Pakistan Stock Exchange, crypto, forex and other live markets
24 recorded lessons · about 11.5 hours · 12 months of access
This article is for education only and is not investment advice. Trading shares, cryptocurrencies, forex and other markets involves risk, including the loss of capital.